

Anthropic released a chart that I think every professional should sit with for a few minutes.
It is a radar diagram comparing two things across roughly 25 occupational categories: how much AI is theoretically capable of helping in each field, and how much it is actually being used today. The blue area is capability. The red area is observed usage. And in most knowledge-work categories, the red area is barely visible inside the blue.
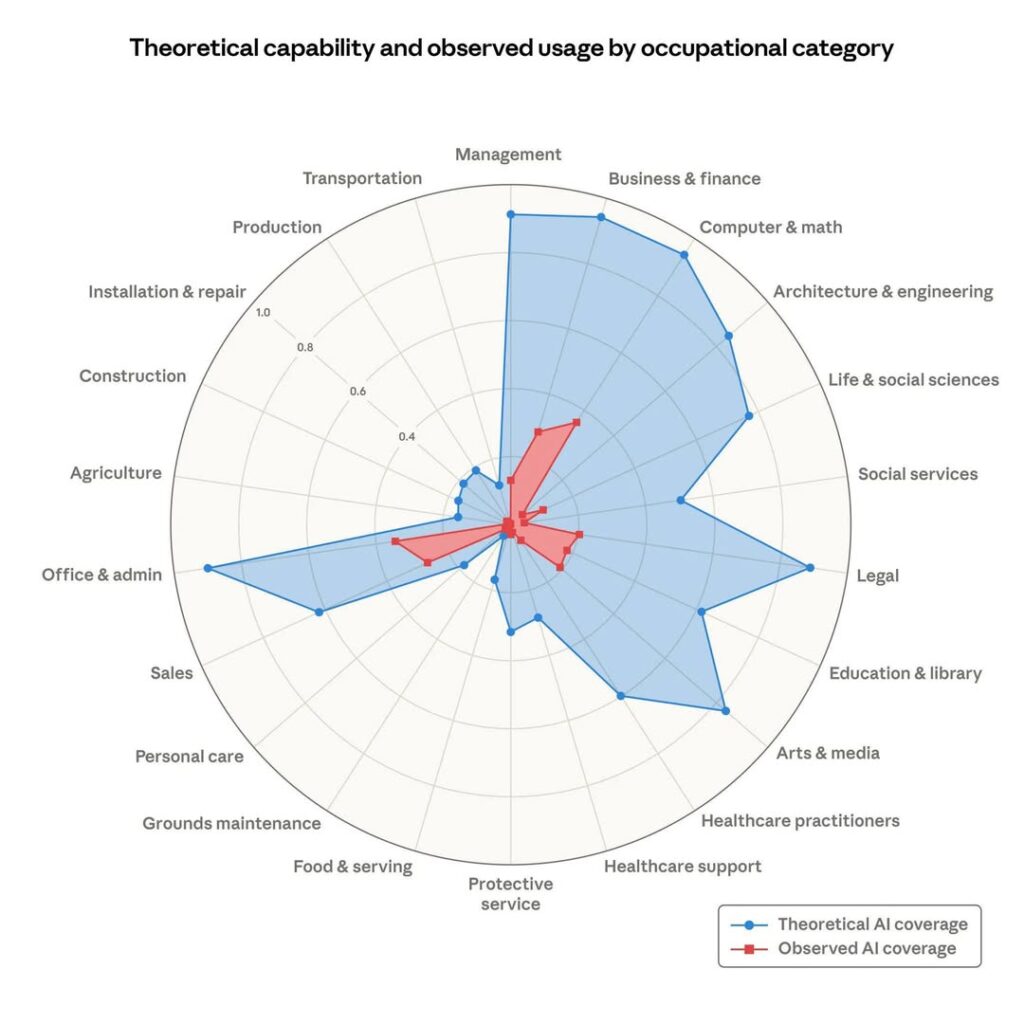
That gap is not a footnote. It is the story.
What the Anthropic chart actually shows
The categories where AI’s theoretical reach is largest are the ones most of us associate with white-collar work: management, business and finance, legal services, computer and math, office and admin. These are the fields where a large share of tasks involve reading, writing, analysis, summarizing, drafting, and decision support. AI tools today can already assist with a significant portion of that work.
And yet the observed usage numbers sit far below the capability line in almost every one of those categories.
The physical-labor categories tell a different story. Construction, agriculture, installation and repair — these show much smaller blue areas to begin with. AI has less to offer there, and usage reflects that. The gap in those fields is smaller not because adoption is higher, but because the capability ceiling is lower.
So the chart is not really about which industries will be disrupted. It is about timing. For knowledge workers, the capability is already there. The adoption has not caught up.
This is a pattern I have seen consistently in organizations I work with through PAIBA. The tools are available. The workflows that would benefit from them are identifiable. But the people doing those workflows are still working the same way they did before AI existed.
Why the gap between capability and usage is so persistent
This is where I think most commentary on AI adoption gets it wrong.
People tend to explain the gap as a technology problem. Tools are too complicated. Interfaces are confusing. Integration requires IT support. And some of that is true.
But in the deployments we have run with teams across the Philippines, the bigger friction is not technical. It is behavioral. People have workflows that work. They have habits built over years. They know how to do their job the way they have always done it, and that familiarity has real value. Switching to an AI-assisted workflow requires unlearning, and unlearning is uncomfortable even when the new way is faster.
It did not go away just because the tool got better.
And that is still worth paying attention to, because it means the gap in the Anthropic chart will not close the way most people expect it to. It will not close because of better tools alone. It will close when teams actively practice working with AI and build new habits alongside the new capability.
The organizations that understand this distinction — that adoption is a behavior change problem, not a technology access problem — are the ones that will close the gap intentionally. Everyone else will wait for the gap to close on them.
The professionals at most risk are in the middle of the blue area
Here is a pattern worth noting in the chart.
The occupational categories with the largest theoretical AI coverage are not the most specialized ones. They are the broad knowledge-work categories: managers, finance professionals, legal workers, office administrators. These are roles that exist in large numbers across almost every industry.
The specialization that protects some professionals — the surgeon, the structural engineer, the craftsperson — is less present in these broad categories. The work is more compositional: write this, summarize that, review this document, prepare this analysis. And that compositional work is exactly where AI capability is strongest today.
This is not a prediction that these roles will disappear. It is an observation that the people in these roles who learn to work with AI will be significantly more productive than those who do not. And when productivity gaps become large enough, organizations notice.
The gap in the chart will close. The question is whether individual professionals will be ahead of that closing or behind it.
What to do differently starting this week
You do not need a transformation program. You need a starting point and a practice.
Pick one recurring task and commit to doing it with AI for four weeks. Not when you have time. Every time that task comes up. A weekly summary, a first draft, a data review, a research brief — pick one thing that happens regularly enough to build a habit around. The goal in week one is not great output. The goal is establishing the reflex.
Use AI visibly in front of your team. If you manage people, bring AI into a meeting — not as a presentation about AI, but as part of your normal workflow. Pull a summary, run a quick analysis, draft a follow-up. Do it where your team can see it. This signals that using AI is expected behavior, and it lowers the psychological barrier for people who are watching you to see if this is serious.
Audit one workflow per month. After you have been practicing for a few weeks, look at a full workflow — not just one task, but a full process from input to output. Identify where AI could assist at each step. In our work with teams through Olern’s AI training programs, the teams that make real progress are not the ones that found one good use case and stopped. They are the ones that kept asking “what’s next” after the first win.
Build a short feedback loop after every AI-assisted task. Spend two minutes asking: Was the output useful? What would have made the prompt better? What should I try differently next time? Write it down somewhere. This is how practitioners improve. It is not complicated, but it needs to be intentional.
The professionals who develop this practice now will have a meaningful head start when the red area in the Anthropic chart starts catching up to the blue.
The future professional does not work alone
The closing image from the chart has stayed with me since I first saw it.
The red area is so small compared to the blue. But it is not zero. People are already doing this. In some organizations, on some teams, in some workflows, the gap is already starting to close. These are the early practitioners, and they are getting faster, more thorough, and more consistent while their peers are still working the way they always have.
The future professional will not work alone. They will work with a team of AI agents — tools that handle research, drafting, analysis, scheduling, and summarizing, while the professional focuses on judgment, relationships, and decisions that require human context.
That future is not ten years away. The capability line on the Anthropic chart says it is available now.
The disruption has not fully arrived yet. That is not a reassurance. That is a warning. Because when the gap closes — and it will close — the advantage will go to those who have already been practicing.
The question is not whether this is coming.
The question is whether you will be the person who figured it out early, or the person who had to figure it out fast.
What task are you currently doing manually that you think AI could assist with? I am curious where the biggest gaps are for the people reading this.
Frequently Asked Questions
What does Anthropic’s AI capability vs. usage chart show?
Anthropic’s chart compares theoretical AI coverage with observed AI usage across roughly 25 occupational categories. It uses a radar diagram where the blue area represents what AI can already help with, and the red area shows how much AI is actually being used today. The gap between them is largest in knowledge-work categories like management, business and finance, legal, and office administration.
Why is observed AI usage so much lower than theoretical AI capability?
The gap exists primarily because of behavioral friction, not technology limitations. Professionals in knowledge-work roles have established habits and workflows that feel safe and familiar. Switching to AI-assisted workflows requires unlearning those habits, which is uncomfortable even when the new approach is faster. Access to AI tools is no longer the main barrier — adoption behavior is.
Which professions are most affected by the gap in AI capability vs. usage?
Knowledge-work professions show the largest gaps: management, business and finance, legal services, office administration, and media. These roles involve high proportions of compositional tasks — writing, summarizing, analyzing, drafting — which are exactly the tasks where AI capability is currently strongest. Physical-labor categories like construction and agriculture show smaller gaps because AI has less theoretical coverage there to begin with.
How should professionals respond to the AI capability gap?
Start with one recurring task and commit to doing it with AI assistance every time it comes up for four weeks. Use AI visibly in front of your team to signal expected behavior. Audit one full workflow per month to identify additional opportunities. Build a short feedback loop after every AI-assisted task to improve your practice deliberately. The goal is to build the reflex before the disruption pressure arrives.
Will AI replace knowledge workers because of this capability gap?
The more likely outcome is not replacement but a productivity divide. Professionals who learn to work with AI will handle more work, at higher quality, with less time. Those who do not will find themselves slower and less competitive relative to their AI-assisted peers. Organizations will notice the productivity gap before they debate job titles.
What is a team of AI agents, and how does this relate to the chart?
A team of AI agents refers to multiple AI tools working in coordination — one handling research, one drafting, one reviewing, one scheduling — while the professional focuses on judgment and relationships. This is the work model that the Anthropic chart’s blue area is pointing toward: not AI replacing the professional, but AI handling the compositional layers of the work so the human can operate at a higher level.

